Summary
BENCH-2026-11 is the official benchmark of vericto-proxy: two dedicated EC2 instances, the direct path to the database measured in the same run, three interleaved repetitions and a repeat on another day on fresh hosts. The figures, with their conditions:
- PostgreSQL (pgbench select-only, extended protocol, one statement per request): the proxy added 0.12 ms at the median from 603 to 3,016 statements/s, and 0.14 ms at 4,223/s. The direct path took 0.29 to 0.31 ms at the median.
- MySQL (sysbench oltp_read_only, 16 statements and about 40 KB per transaction): 1.6 ms per transaction, about 0.1 ms per statement, from 36 to 250 transactions/s.
- The tail depends on load: the added p99 on PostgreSQL was 0.19 ms at 10% of the task's capacity, 1.34 ms at 30% and 2.71 ms at 50%. At 0.5 vCPU that tail is mostly the wait for the CPU quota, not the evaluation: size the task to run at about 50% of its CPU.
- Cost and scale: about 0.1 vCPU per 1,000 statements/s (0.105 on PostgreSQL, 0.097 on MySQL). Two 0.5 vCPU tasks sustained 9,049 statements/s against 4,826/s for one, about 1.9 times, with the load split evenly.
- Stable: on the second day, on fresh hosts, the added median moved by at most 0.03 ms up to 70% of capacity.
These are small statements: a larger statement adds more, and the statement-size sweep has not run on EC2 yet (see Limitations). It is a measurement under these conditions, not a guarantee.
What we measured, and why
A SQL firewall sits in the path of every query: everything your application sends crosses it before it reaches the database. Its cost is not only evaluating the rules, which takes microseconds in process; it is the whole extra hop: two TLS sessions, reading the protocol, evaluating the rules and sending telemetry. That is what we measured: the latency the proxy adds over going straight to the database, at fixed rates, and the CPU it uses to do it.
Three numbers often get mixed up: rule evaluation (microseconds, in process), added latency (what your application notices) and throughput (how much one task carries before its latency degrades). This page publishes the last two, each with its conditions, and shows the tail (p99), not just the median.
Setup
| Component | Configuration |
|---|---|
| Hosts | System under test: c7g.2xlarge (8 Graviton3 cores, no SMT). Load generator: c7g.xlarge. Both in one cluster placement group in us-east-1a, in their own VPC. Steal time 0% on both hosts. |
| CPU | The proxy on its own core with a 50% CFS quota (0.5 vCPU, as a Fargate task); the baseline intermediary on another core with the same budget; the databases on three cores; the OS and interrupts on core 0. |
| Proxy | vericto-proxy 4.14.2, image vericto/vericto-proxy@sha256:0446e435…85eb6b, engine 4.3.0, 42 built-in rules with the default policy (critical and high block, medium flags, low records), enforce mode, full telemetry to a local control-plane stand-in that answers instantly, RUST_LOG=info. |
| Databases | PostgreSQL 17.6 and MySQL 8.4.11 in containers on the system under test, on gp3, with durability on (fsync, synchronous_commit, innodb_flush_log_at_trx_commit=1) and buffers larger than the data. pgbench at scale 100 (10,000,000 accounts) and sysbench with 8 tables of 1,000,000 rows, checksummed after loading. |
| TLS | On both legs (client to proxy and proxy to database) in every published cell. |
| Workloads | PostgreSQL: pgbench select-only over the extended protocol, where the proxy reads and evaluates every execution. MySQL: sysbench oltp_read_only (10 point selects and 4 ranges in a transaction: 16 statements, about 40 KB of results), replayed open loop over the text protocol. |
| Baselines | Direct (client to database); HAProxy 3.0 in TCP mode, with the same core and quota: the cost of the hop alone (it relays the TLS session end to end, so it pays no cryptography); and Vericto in enforce mode, the way customers run it. |
| Harness | vericto-bench (Apache-2.0), commit 40d69b8bbb01 on day 1; every image pinned by digest, and each host's provenance (kernel, AMI, THP, chrony, cgroups) recorded in the run's manifest. |
Method
- Open loop at fixed rates. Request i is due at
start + i/rate, and latency is measured from that intended time, not from when it left: a stall counts against every request due during it (no coordinated omission). pgbench-Ruses a Poisson schedule, and its lag is added to the latency. HdrHistogram histograms with 3 significant digits, one interval every 10 s. - Cells. 60 s of warm-up discarded and 300 s measured, at 10, 30, 50, 70, 80, 90 and 100% of S, with the same absolute rates for every target. S is the closed-loop maximum of Vericto enforce at 0.5 vCPU with TLS: 6,033 statements/s on PostgreSQL and 357 transactions/s (5,706 statements/s) on MySQL.
- Repetitions. 3 per rate, interleaved: every target runs at a rate before the next rate, in an order from a seeded balanced Latin square. The headline curves were repeated on a second day on freshly created hosts, at the same rates, with 1 repetition.
- Added latency. In each repetition, Vericto minus direct at the same rate in the same repetition, percentile by percentile; across repetitions, the mean with a Student t 95% interval. An interval that contains zero is published as "not distinguishable from the direct path", never as zero.
- Validity, with no outlier removal. A repetition is invalid only for a reason registered before the run (errors above 0.1%, load-generator CPU above 70%, steal time above 1%, a cell that is not steady); it is kept in the raw data and rerun once. A cell whose achieved rate falls below 99% of the offered rate is saturated: it ends the curve and is never quoted as latency.
- Traffic caps. Every interface is counted every second; a cell aborts above 400 Mbps per component or 800 Mbps in total for 3 consecutive seconds. No published open-loop cell was aborted; on MySQL, the closed-loop steps of the faster baselines did hit the cap.
- Generator check. Once a minute, during an open-loop cell, the database is paused for one second: an honest generator must see it in about 1% of requests. It saw it in 0.97% and 0.95% (0.83% expected).
- CPU. The proxy container's CPU (cgroup) every second, and a linear fit against the statements/s it carried, over the open-loop cells below 80% of S.
Results
Day 1, mean of 3 repetitions with its 95% interval. Published latency goes up to 70% of S: on day 2, on another host, the PostgreSQL 80% cell was no longer steady.
PostgreSQL: added latency by rate
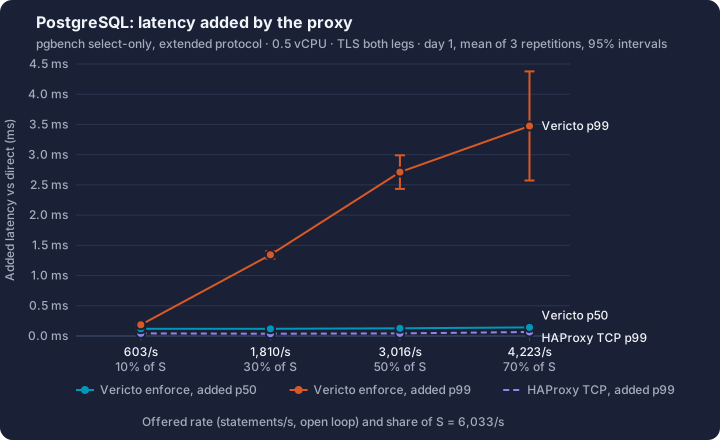
| Offered rate (statements/s) | Share of S | Direct p50 / p99 (ms) | Vericto, added p50 [95%] (ms) | Vericto, added p99 [95%] (ms) | HAProxy, added p50 / p99 (ms) | Proxy CPU (vCPU) |
|---|---|---|---|---|---|---|
| 603 | 10% | 0.31 / 0.37 | 0.119 [0.115, 0.122] | 0.19 [0.18, 0.19] | 0.036 / 0.044 | 0.07 |
| 1,810 | 30% | 0.30 / 0.34 | 0.120 [0.114, 0.125] | 1.34 [1.28, 1.41] | 0.032 / 0.038 | 0.20 |
| 3,016 | 50% | 0.29 / 0.34 | 0.128 [0.117, 0.139] | 2.71 [2.43, 2.99] | 0.033 / 0.043 | 0.33 |
| 4,223 | 70% | 0.29 / 0.35 | 0.142 [0.132, 0.153] | 3.47 [2.57, 4.38] | 0.033 / 0.066 | 0.45 |
The median hardly moves with load (0.12 to 0.14 ms). The p99 does: from 0.19 ms at 10% of S to 2.71 ms at 50% and 3.47 ms at 70%. HAProxy in TCP mode, with the same core and quota, added 0.03 to 0.04 ms at p50 and 0.04 to 0.07 ms at p99: the hop alone is cheap. HAProxy relays the TLS session untouched; the proxy terminates and reopens TLS on both legs, reads the protocol and evaluates the rules. How that cost splits between the parts is in the follow-up batch.
MySQL: added latency per transaction
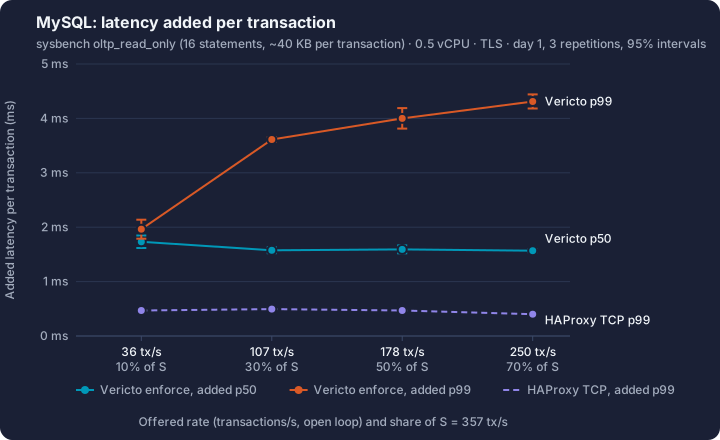
| Offered rate (transactions/s) | Share of S | Direct p50 / p99 per transaction (ms) | Vericto, added p50 per transaction [95%] (ms) | Added p50 per statement (ms) | Vericto, added p99 per transaction [95%] (ms) | HAProxy, added p50 / p99 (ms) | Proxy CPU (vCPU) |
|---|---|---|---|---|---|---|---|
| 36 | 10% | 2.66 / 3.27 | 1.73 [1.62, 1.85] | 0.108 | 1.96 [1.79, 2.14] | 0.48 / 0.47 | 0.06 |
| 107 | 30% | 2.57 / 3.18 | 1.58 [1.52, 1.63] | 0.099 | 3.61 [3.57, 3.65] | 0.49 / 0.50 | 0.17 |
| 178 | 50% | 2.55 / 3.16 | 1.59 [1.52, 1.67] | 0.100 | 4.00 [3.81, 4.19] | 0.51 / 0.47 | 0.28 |
| 250 | 70% | 2.51 / 3.16 | 1.57 [1.54, 1.60] | 0.098 | 4.31 [4.18, 4.44] | 0.44 / 0.40 | 0.39 |
Per 16-statement transaction, the proxy added 1.57 to 1.73 ms at the median, about 0.1 ms per statement, flat from 10 to 70% of S. The p99 was 1.96 ms at 10% and 3.6 to 4.3 ms from 30 to 70%. HAProxy added 0.44 to 0.51 ms per transaction: each transaction returns about 40 KB, which any intermediary has to relay.
CPU against throughput
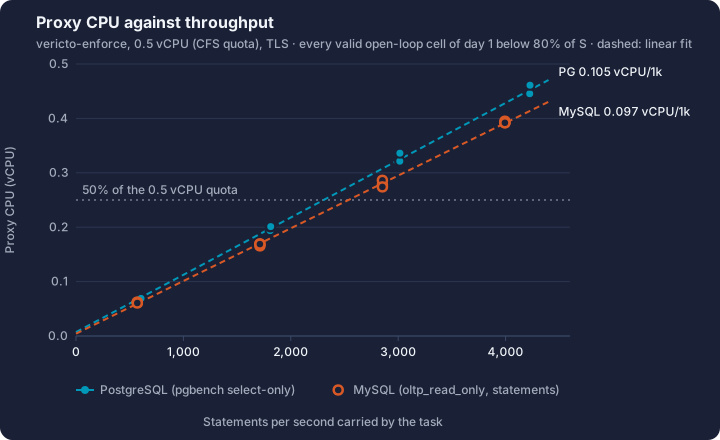
| Workload | vCPU per 1,000 statements/s [95%] | Cells | USD per month per 1,000 statements/s, at 70% utilisation |
|---|---|---|---|
| PostgreSQL (pgbench select-only) | 0.105 [0.103, 0.108] | 12 | 3.56 |
| MySQL (oltp_read_only, per statement) | 0.097 [0.095, 0.099] | 12 | 3.27 |
The cost is linear: about 0.1 vCPU per 1,000 statements/s on both engines, starting near zero. At the Fargate ARM64 list price (USD 0.03238 per vCPU-hour) and a 70% utilisation target, that is about USD 3.6 (PostgreSQL) and 3.3 (MySQL) per month per 1,000 statements/s.
One task or two
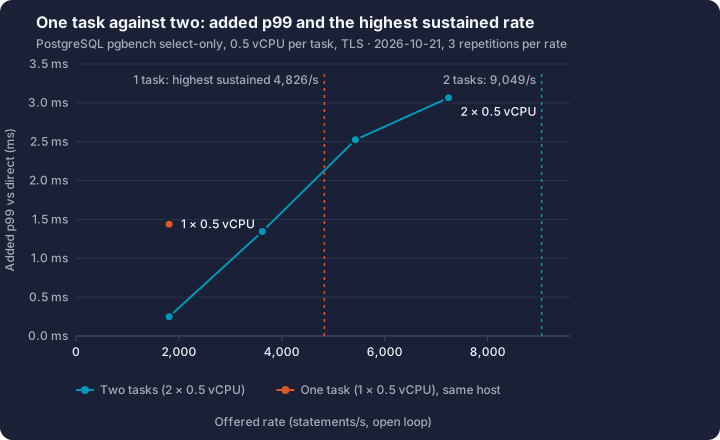
| Proxy | Offered rate (statements/s) | Achieved (statements/s) | Added p50 (ms) | Added p99 (ms) | vCPU per task (1 / 2) |
|---|---|---|---|---|---|
| 1 × 0.5 vCPU | 1,810 | 1,807 | 0.12 | 1.44 | 0.20 |
| 2 × 0.5 vCPU | 1,810 | 1,807 | 0.12 | 0.25 | 0.11 / 0.10 |
| 2 × 0.5 vCPU | 3,620 | 3,611 | 0.12 | 1.34 | 0.19 / 0.20 |
| 1 × 0.5 vCPU | 5,429 | saturated (3 of 3); 4,732/s achieved | – | – | 0.50 |
| 2 × 0.5 vCPU | 5,429 | 5,424 | 0.12 | 2.52 | 0.31 / 0.27 |
| 1 × 0.5 vCPU | 7,239 | saturated (3 of 3); 2,903/s achieved | – | – | 0.50 |
| 2 × 0.5 vCPU | 7,239 | 7,231 | 0.14 | 3.07 | 0.38 / 0.38 |
| 2 × 0.5 vCPU | 10,859 | saturated (3 of 3); 10,443/s achieved | – | – | 0.50 / 0.50 |
| 2 × 0.5 vCPU | 13,272 | saturated (3 of 3); 9,341/s achieved | – | – | 0.50 / 0.50 |
| 2 × 0.5 vCPU | 9,049 | 9,040 (the highest sustained) | not published | not published (the interval crosses zero) | 0.44 / 0.48 |
On staging, two tasks had saturated below the one-task curve; on EC2 that does not reproduce. Two tasks sustained 9,049 statements/s against 4,826/s for one (the 80% cell of the day-1 curve), about 1.9 times, with the load split evenly (0.44 and 0.48 vCPU). At the same rate, two tasks cut the added p99 from 1.44 to 0.25 ms (1,810/s), because each works at half the pressure on its quota. With one task, the same host saturated at 5,429/s.
Day 1 against day 2
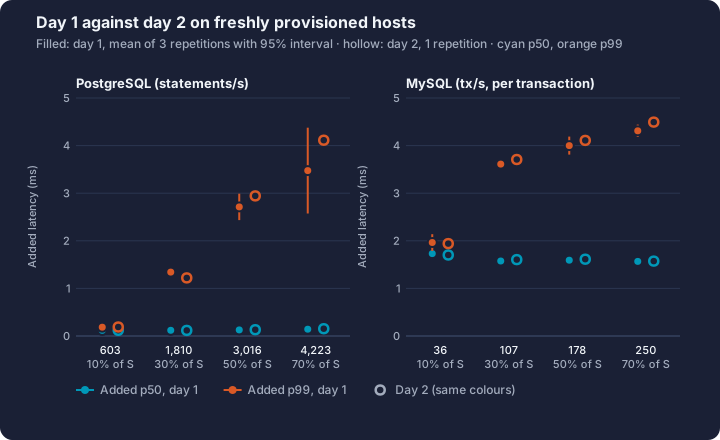
| Curve and rate | Share of S | Day 1, added p50 / p99 (ms) | Day 2, added p50 / p99 (ms) | Difference p50 / p99 (ms) |
|---|---|---|---|---|
| PostgreSQL, 603/s | 10% | 0.119 / 0.19 | 0.120 / 0.19 | 0.001 / 0.00 |
| PostgreSQL, 1,810/s | 30% | 0.120 / 1.34 | 0.117 / 1.22 | −0.003 / −0.12 |
| PostgreSQL, 3,016/s | 50% | 0.128 / 2.71 | 0.133 / 2.94 | 0.005 / 0.23 |
| PostgreSQL, 4,223/s | 70% | 0.142 / 3.47 | 0.154 / 4.11 | 0.012 / 0.64 |
| MySQL, 36 tx/s | 10% | 1.732 / 1.96 | 1.702 / 1.94 | −0.030 / −0.02 |
| MySQL, 107 tx/s | 30% | 1.576 / 3.61 | 1.606 / 3.71 | 0.030 / 0.10 |
| MySQL, 178 tx/s | 50% | 1.593 / 4.00 | 1.614 / 4.11 | 0.021 / 0.11 |
| MySQL, 250 tx/s | 70% | 1.568 / 4.31 | 1.574 / 4.49 | 0.006 / 0.18 |
Up to 70% of S, the added median moved by at most 0.012 ms on PostgreSQL and 0.030 ms on MySQL between days and hosts; the p99 by at most 0.64 ms (PostgreSQL at 70%, inside day 1's interval) and 0.18 ms on MySQL. On the day-2 host the PostgreSQL 80% cell was not steady (the knee came earlier), which is why the published figures stop at 70% of S.
How to read it, and sizing
- Budget about 0.1 vCPU per 1,000 statements/s. In the test, 1,810 statements/s used 0.20 vCPU, 40% of the quota of a 0.5 vCPU task.
- Scale out at about 50% CPU. The p99 grows with the load on the quota: 0.19 ms with the task at 14% of its CPU (603/s), 1.34 ms at 40% (1,810/s), 2.71 ms at 65% (3,016/s) and 3.47 ms at 90% (4,223/s). Adding a task spreads the pressure: with two tasks, the p99 at 1,810/s was 0.25 ms.
- Why the tail rises under a small quota. 0.5 vCPU is a CFS quota: the task may use half of every scheduling period. When a burst uses up the quota early, every statement that arrives afterwards waits for the next period, however fast the proxy is. The median does not see it; the p99 does, more often the busier the task. The 1 vCPU curve, which separates those waits from the proxy's own cost, is in the follow-up batch.
- Deploy the proxy next to the database. Here the proxy-to-database leg is on the same host; in a VPC, every network hop adds its own round trip. Put the proxy in the same availability zone as the database.
- Measure it with your own traffic. Every audit-trail event stores the latency of its evaluation (
latency_ms), so you can compare these figures with yours.
Limitations
- Not staging. The figures come from dedicated EC2. The staging sessions (Fargate behind an NLB and Aurora, inside one VPC) are context and are not the headline. One instance family only (Graviton3): the Intel cross-check was dropped for budget.
- Small statements only. A key lookup on PostgreSQL and a 16-statement read transaction on MySQL. What is added grows with statement size; the size sweep is in the follow-up batch, and until then the reference is the staging curve below.
- Not run yet (follow-up batch): the statement-size sweep, large results and masked columns, observe and offline modes in open loop, 1 vCPU, the PgBouncer and ProxySQL baselines, TLS off, tpcb-like and the other protocol modes, the ORM-style mix, blocked statements and connection setup.
- MySQL at high rates is limited by the traffic cap, not by the proxy: at about 40 KB per transaction, the closed-loop maxima of the faster baselines pass 400 Mbps, and those steps were aborted on purpose.
- The environment is kinder than yours on two points: the leg to the database is local, and the stand-in control plane answers instantly (the backend's ingest cost is not measured here). Built-in rules only: no custom rules, allowlists or masking.
- Day 2 has 1 repetition per cell: it tests stability, it does not narrow the intervals. The day-1 cells shared the load generator with one-second bursts from the harness's progress sync (fixed for later runs; day 2 matches day 1). Each cell lasts 5 minutes: memory growth over hours is not covered.
Reproduce it
The harness is vericto-bench (Apache-2.0): the Terraform for the two hosts, the runner, the suites, the analysis and the report that produced every table on this page. Anyone can run it in their own AWS account, without Vericto's backend; the whole campaign cost about USD 18 at list prices.
Code: github.com/vericto/vericto-bench. Results of this campaign (manifests, cells, reports, charts and SHA-256 checksums): results/bench-2026-11.
Raw data
The per-interval histograms, the pgbench per-transaction logs, the CPU and traffic counters and the proxy logs: 3.9 GB, kept with their SHA-256 checksums. They are available on request through contact until they are published with the repository.
Earlier staging measurements (context)
Before this run, on staging on October 16, 2026 (vericto-proxy 4.12.0 on a 0.25 vCPU ARM64 Fargate task, Aurora Serverless v2, TLS, enforce mode, an ORM-style mix), we measured what BENCH-2026-11 does not cover yet. They are context, not headline figures:
- Statement size: on PostgreSQL, a 10-row INSERT added 0.58 ms at p50; 100 rows, 1.05 ms, already above a millisecond; 500 rows, 3.07 ms; 1,000 rows, 5.54 ms.
- Rule evaluation alone, no network: p99 of 100 µs or less for the OLTP statements (vericto-engine 3.9.0).
- Telemetry: 0 of the 1,222,254 events sent to the control plane during the session were lost.